Guidelines for Optimizing PCR: Introduction
The Polymerase Chain Reaction (PCR) is one of the more utilized protocols in the genetic sciences. The development of PCR has allowed researchers to amplify a specific region of genomic DNA. It has made it possible to amplify millions of copies of DNA. PCR applications have expanded to include sequencing, fragment analysis, real time PCR, chip arrays and other techniques. Although the design of many of the new technologies differs from basic PCR, they all use the same principle to amplify DNA.
The PCR procedure itself has changed little over the years. However, better polymerase enzymes for catalyzing the process have been developed. The thermocycler for heating and cooling has even been improved. PCR reactions consist of a premix composed of deoxynucleotides (dNTPs) to supply the necessary bases and Taq polymerase to catalyze the reaction mixed in a buffered medium. Then a template and markers (forward and reverse primers) are added. The template is the DNA to be amplified. The markers determine what region is amplified. This soup is then placed in a thermocycler to be heated and cooled which causes the DNA to be amplified.
One of the more difficult issues with PCR is to ensure that only a single region of DNA is being amplified so that copies of that region only are all that is produced. This requires adjustments in the PCR mix and in the thermocycling conditions to optimize the reaction. Secondary products often result when PCR conditions are not fully optimized. It is particularly important in fragment analysis applications when multiple groups of primers are added to the same mix in order to amplify different regions together in one reaction.
Variables in PCR Optimization
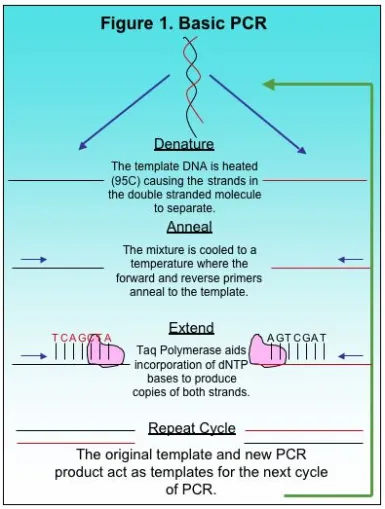
A typical PCR cycle is shown in Figure 1. The template and markers are added to a buffered solution containing Taq polymerase and dNTPS before the mixture is placed in the thermocycler. It is also important to note that the buffer includes magnesium chloride (MgCl2) as a necessary co-factor. A common cycle for PCR includes the denaturing step, the annealing step, and then the extension. The mix is first heated to approximately 95 C to denature the double stranded template. This opens up the DNA for the markers and Taq polymerase. After heating, the mixture is cooled to allow the markers to anneal to the complimentary region. Finally, the mix is heated slightly for extension. During extension, the polymerase moves along the template DNA incorporating dNTPs to produce a complimentary copy of the template. At the end of one cycle, an identical copy of the desired region is produced as a small PCR fragment. The newly produced fragment and the original template both function as template DNA for the next cycle in PCR amplification. After 25 cycles, millions of copies of a given region are produced and used for further study.
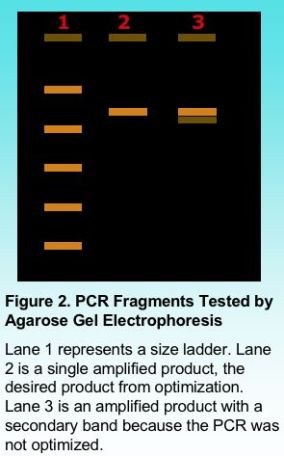
Once PCR amplification is complete, the PCR fragments can be tested for purity using agarose gel electrophoresis. Including a standard ladder with known fragment sizes provides an indication of the size of the amplified product as shown in Figure 2. Once PCR conditions are well optimized, the PCR product should appear as a clean single band. The presence of smaller secondary bands sometimes results from mis-priming when the PCR is not completely optimized. It is possible to gel purify a product by cutting the desired band from the gel and isolating the DNA using a commercial kit. However, even a single band can mask the presence of a secondary band. It is important to have a single clean product, particularly for additional testing such as automated DNA sequencing.
PCR can be Multiplexed
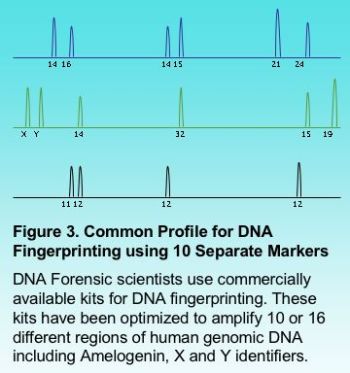
Multiplexing a PCR reaction is particularly useful in automated fragment analysis when different sets of markers carry a different fluorophore (fluorescent label). Multiplexing can provide savings in time and cost when a large number of samples are to be analyzed. Figure 3 shows the results for a fragment analysis application multiplexing 10 different markers. This is very common in forensic science where DNA fingerprinting typically multiplexes up to 16 different regions.
The next few articles will focus on the variables involved in basic PCR and how PCR can be optimized.


