DNA Sequencing and Fragment Analysis

Posts tagged ‘PCR’

Guidelines for Optimizing PCR: Concentration of Target DNA and Primers

The Polymerase Chain Reaction, or PCR, is a basic method used in molecular biology to produce copies of a small target region of DNA in a sample. The basics to PCR were discussed previously here. The copies of DNA produced by PCR provide researchers with sufficient copies for other applications in research including automated Sanger sequencing. Although there is basic methodology to most PCR methods, each reaction is different and requires optimization, a process for adjusting variables and producing a single desired product.  There are several factors to consider when optimizing PCR such as total copies of target DNA, primer concentration, MgCl2 and deoxynucleotides, or dNTPs.  Some of these variables depend on the total volume of the PCR reaction because the final concentration of the components in PCR should be constant depending on whether the reaction is 25 ul, 50 ul or 100 ul. In this article we will focus on two variables, the number of copies of the target DNA and primer concentration.

The Template: Target DNA

Generating copies of a target DNA region using PCR applications is not as sensitive to the quality of the template DNA when compared to Sanger sequencing. However, it is still advisable to use a relatively pure DNA sample free from salts and other contaminants. Clean template DNA has a better probability to generate a clean PCR product. The final diluted sample of target DNA is better diluted in water rather than buffer because buffers can interfere with difficult PCR amplifications.

The most important aspect of the target DNA to consider is the total number of copies in the reaction available for amplification. The target DNA provides the initial template for the amplification of the first set of products amplified and continues to provide the template for the remaining cycles. As PCR products are generated, they also provide copies of the target DNA used as a template for amplification. This is what allows PCR to generate millions of copies of a target region. Therefore, it is important that sufficient copies of the original target DNA are present in the reaction. Too many copies of the original target can lead to generation of false products early in PCR that also act as template DNA. The template DNA isolated from bacteria may consist of only a 2 million-base genome whereas the human genome has 3 billion bases. Therefore, bacterial genomic DNA will have far more copies of the target in a 50 ng sample than human DNA. For bacterial DNA 10E5 copies will require only 300 picograms of DNA. For human DNA 10E5 will require over 300 nanograms of DNA, a one million fold difference.

PCR conditions generally recommend 10E4 to 10E5 copies of the target DNA in the reaction independent of the total volume. There is some flexibility in the copy number of the target sequence. However, more copies of the target DNA will reduce specificity of the PCR reaction and likely produce a greater number of false products. The total number of cycles for PCR should be reduced when higher concentrations of target DNA are in the reaction.

Concentration of the Primers

Primers are the determining factor of what region of the DNA will be amplified by PCR. The forward and reverse primer must have an exact base match with the beginning and end of the target region. Excessive primer concentration is perhaps one important factor that often causes generation of false products in a PCR. Too much primer reduces specificity and this will allow primers to anneal in regions of the template that are not the target region. The results of excessive primers are often seen in unclean Sanger sequencing results because false products can be sequenced along with the desired target. The amount of forward and reverse primer should be limited to reduce potential false priming. Excessive concentrations of forward and reverse primers can also cause formation of primer dimer when the primers anneal and amplify themselves independent of the target DNA.

Primer concentration is one variable dependent on the total volume of the PCR reaction in order that sufficient copies of the primer find the target annealing sites. A total concentration of 0.5 micro-Molar (uM) to 1 uM is generally sufficient to amplify most target regions, although a smaller concentration may also work in some applications. Typically our lab uses a final concentration of 0.8 uM for most PCR reactions. The final judgment on primer concentration will be viewed after products are electrophoresed on an agarose gel in order to show the number of products amplified.

We use a relatively simple calculation to dilute primers to a final concentration of 10 uM as shown starting with the primary primer concentration of 1 micro-grams (ug)/ micro-liter (ul). It requires that the molecular weight (MW) of the primer is known and should be provided along with the primer.

1 ug/ul  *1umol/MW (ug) *10E6 ul/l  = concentration umol/l which equals  uM

A primer with the final concentration of 200 uM will be diluted by adding 1 ul of the primer to 19 ul of water for a final concentration of 10 uM. This is our working concentration for PCR. For a final concentration of 0.8 uM, 2 ul of the forward and reverse primer are added to a 25 ul reaction whereas 8 ul of each would be added to a 100 ul PCR reaction.

Primer concentration is one of the more important variables to consider when optimizing a PCR reaction. Concentrations greater than 1 uM could often lead to primers annealing along non-target regions and the generation of false products.  Insufficient concentrations of either primer could result in little or no amplification.
Please go here if you would like to download a

reprint for this article in pdf format

Guidelines for Optimizing PCR: Introduction

The Polymerase Chain Reaction (PCR) is one of the more utilized protocols in the genetic sciences. The development of PCR has allowed researchers to amplify a specific region of genomic DNA. It has made it possible to amplify millions of copies of DNA. PCR applications have expanded to include sequencing, fragment analysis, real time PCR, chip arrays and other techniques. Although the design of many of the new technologies differs from basic PCR, they all use the same principle to amplify DNA.

The PCR procedure itself has changed little over the years. However, better polymerase enzymes for catalyzing the process have been developed. The thermocycler for heating and cooling has even been improved. PCR reactions consist of a premix composed of deoxynucleotides (dNTPs) to supply the necessary bases and Taq polymerase to catalyze the reaction mixed in a buffered medium. Then a template and markers (forward and reverse primers) are added. The template is the DNA to be amplified. The markers determine what region is amplified. This soup is then placed in a thermocycler to be heated and cooled which causes the DNA to be amplified.

One of the more difficult issues with PCR is to ensure that only a single region of DNA is being amplified so that copies of that region only are all that is produced. This requires adjustments in the PCR mix and in the thermocycling conditions to optimize the reaction. Secondary products often result when PCR conditions are not fully optimized. It is particularly important in fragment analysis applications when multiple groups of primers are added to the same mix in order to amplify different regions together in one reaction.

Variables in PCR Optimization

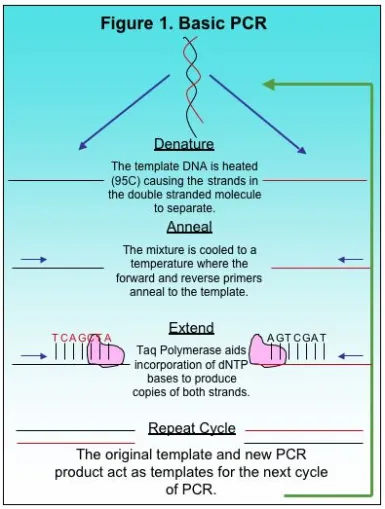
A typical PCR cycle is shown in Figure 1. The template and markers are added to a buffered solution containing Taq polymerase and dNTPS before the mixture is placed in the thermocycler. It is also important to note that the buffer includes magnesium chloride (MgCl2) as a necessary co-factor. A common cycle for PCR includes the denaturing step, the annealing step, and then the extension. The mix is first heated to approximately 95 C to denature the double stranded template. This opens up the DNA for the markers and Taq polymerase. After heating, the mixture is cooled to allow the markers to anneal to the complimentary region. Finally, the mix is heated slightly for extension. During extension, the polymerase moves along the template DNA incorporating dNTPs to produce a complimentary copy of the template. At the end of one cycle, an identical copy of the desired region is produced as a small PCR fragment. The newly produced fragment and the original template both function as template DNA for the next cycle in PCR amplification. After 25 cycles, millions of copies of a given region are produced and used for further study.

Image

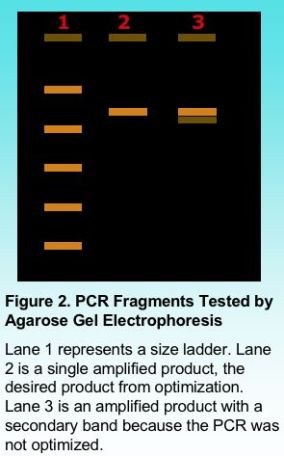
Once PCR amplification is complete, the PCR fragments can be tested for purity using agarose gel electrophoresis. Including a standard ladder with known fragment sizes provides an indication of the size of the amplified product as shown in Figure 2. Once PCR conditions are well optimized, the PCR product should appear as a clean single band. The presence of smaller secondary bands sometimes results from mis-priming when the PCR is not completely optimized. It is possible to gel purify a product by cutting the desired band from the gel and isolating the DNA using a commercial kit. However, even a single band can mask the presence of a secondary band. It is important to have a single clean product, particularly for additional testing such as automated DNA sequencing.

Image

PCR can be Multiplexed

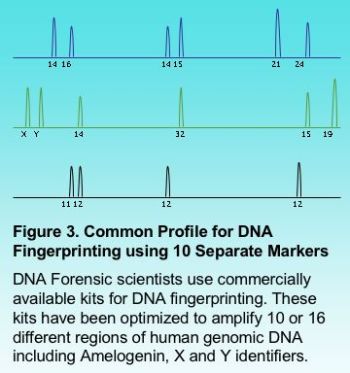
Multiplexing a PCR reaction is particularly useful in automated fragment analysis when different sets of markers carry a different fluorophore (fluorescent label). Multiplexing can provide savings in time and cost when a large number of samples are to be analyzed. Figure 3 shows the results for a fragment analysis application multiplexing 10 different markers. This is very common in forensic science where DNA fingerprinting typically multiplexes up to 16 different regions.

Image

The next few articles will focus on the variables involved in basic PCR and how PCR can be optimized.

Please go here if you would like to download a

reprint for this article in pdf format

Primer Selection Guidelines: Good Primers Important for PCR and Automated Sequencing

DNA synthesis is the production of short, single-stranded DNA molecules (called primers or oligonucleotides) often used in the polymerase chain reaction (PCR) and DNA amplification for Sanger sequencing applications. The region of DNA amplified is determined by an exact match of the primer to its complimentary bases on a given DNA strand. Primer sequences are determined from known sequence since there must be a match to the region of DNA to be amplified.

PCR amplification requires 2 primers that determine the region of sequence amplified in the forward and reverse direction. The forward primer is designed along one strand in the direction toward the reverse primer. Likewise, the reverse primer is designed from the complimentary strand. PCR is exponential amplification in which the newly generated PCR fragment from one cycle also acts as a template for the next cycle (Figure 1A).

Amplification of DNA for Sanger sequencing differs from PCR in that a single primer is used. Amplification is the reproduction of one strand using the compliment from the original strand. Newly generated PCR fragments are single stranded and do not provide a complimentary strand that could act as a template for additional amplification (Figure 1B).

Differences in amplification between PCR and Sanger sequencing were discussed previously (Sanger Sequencing Amplification Compared to Basic PCR).

Simply designing the sequence of the primer from known sequence does not ensure the primer will anneal to the desired region and initiate amplification. The primer should be designed following a set of given standards that improve the chances of success. The guidelines for designing primers used in PCR and sequencing are fairly similar. Primers are designed in the 5’ to 3’ direction to compliment the direction of amplification.

For those utilizing PCR and Sanger sequencing in everyday applications, primer design could seem like yesterday’s news. However, we still believe reviewing good primer design guidelines is helpful to any researcher involved in genetic research.

Guidelines for Primer Design

G1. Primer length should be in the range of 18 to 22 bases. Primers less than 18 bases will have a low melting temperature (Tm values) and might not anneal to the template. There is some flexibility for designing primers longer than 18 bases. Longer primers are frequently designed from template regions that are AT-rich and need additional bases to increase the Tm value.

G2. The primer should have GC content of 50% to 55%.   This is the equivalent of 9 or 10 GC bases included in an 18 base primer. Sometimes there are regions on a template that are AT-rich which prevents meeting this guideline. In those cases it is recommended to design a primer longer than 18 bases.

G3. Primers should have a GC-lock on the 3’ end. A GC-lock is designed when 2 of the final 3 bases is a G or a C. The 3’ base should always be a G or a C.

G4. The melting temperature of any good primer should be in the range of 50OC to 55OC. However, guidelines particularly related to Tm value have some flexibility. Melting temperatures are directly related to the PCR cycle annealing temperature. Tm values that are too low may not anneal well during PCR. High values could be too stringent causing difficulty locating the correct annealing site on the template.

G5. The primer should not include poly base regions. This is when 4 or more bases in a row are the same. This guideline helps prevent potential slippage in which the primer shifts from the annealed position.

G6. Four or more bases that compliment either direction of the primer should be avoided. This prevents the primer from annealing to itself and forming what is referred to as primer-dimer. Primer-dimers have the capability of amplifying the primer itself causing short secondary sequence.

PCR Specific Guidelines

G7. Forward and reverse primers used in PCR amplification should have similar melting temperatures (+/- 2OC). This allows a 4OC difference in total melting temperatures. Researchers involved in using PCR amplification will use primer Tm values in an effort to optimize PCR cycles. Similar Tm values for forward and reverse primers aid optimization efforts. Multiplex PCR applications using multiple primer pairs should all have similar Tm values. A wide range in primer melting temperature complicates PCR optimization.

G8. Forward and reverse primers should not have regions 4 bases or longer that compliment. Just like a primer used in Sanger sequencing, forward and reverse primers used in PCR can anneal to each other and form primer-dimers.

G9. The Tm values for tailed primers should include the tail in calculating melting temperature. Yes, melting temperatures will be greater than 55OC. However, the additional bases in the tail will add to the amplified PCR fragment and become part of the priming site. Tailed primers are often used to add restriction sites to an amplified product.

Primer design is an important aspect relating to many forms of PCR including basic PCR, fragment analysis, quantitative analysis and Sanger sequencing. Below is a link that offers free primer design software…

http://frodo.wi.mit.edu/

We invite any additional guidelines or comments that may be useful to both experienced researchers and those new to primer design.

Please go here if you would like to download a

reprint for this article in pdf format

Automated Fragment Analysis Improves Accuracy Over Manual Methods

Automated capillary sequencers are also capable of performing fragment analysis applications. The process is similar to sequencing because fluorescent dyes are used to label products amplified by PCR. Fragment analysis is often performed manually loading amplified products on agarose gel. It is a relatively simple and cost effective method for conducting fragment analysis. However, there are also limitations. First, there is no method for accurately calculating fragment sizes even with a size ladder. Second, multiplexing is not possible when product sizes from multiple primer pairs (markers) are similar in size. Finally, agarose gels does not have the resolution capabilities that capillary electrophoresis has. Capillary electrophoresis, used in forensics fingerprinting, provides remarkable accuracy to fragment analysis applications.

Automated Fragment Analysis Uses Color Fluorescent Dyes

The Polymerase Chain Reaction (PCR) first amplifies samples that will be compared by fragment analysis. For manual applications, the forward and reverse primer are simply unlabeled oligonucleotides. For automated capillary equipment the forward primer contains a fluorescent label on the 5’end. The amplified product will also be labeled following PCR because the product includes both primers (figure 1). The forward and reverse primers (markers) determine the region and base pair size of the resulting amplification.

There are advantages to using fluorescent labels in the amplification process. Capillary analyzers recognize fluorescent emission wavelengths (different colors). This adds the capacity to multiplex more than one set of primers in an amplification reaction. For example, forensic science currently runs 16 separate markers in one multiplexed reaction. Markers are labeled with four different fluorescent dyes. Fragment sizes add a second parameter because fragments with the same dye, but amplified with different markers, never overlap.

A Standard is Added to Every Sample

Another parameter that increases accuracy and resolution in automated fragment analysis applications is the addition of a given standard to every sample. The base pair sizes of test samples are calculated using this standard. Motility variance that could occur from one capillary to the next is eliminated because a standard curve is determined for each capillary. Each fragment in the standard would need to be labeled with fluorescent dye. However, the standard uses a unique label not used for any of the samples, typically ROX or TAMRA.

Resolution of Automated Capillary Fragment Analysis is 1 Base Pair

The resolution capability of capillary fragment analysis is 1 base pair. The same technology that separates each base in sequencing is also applied to fragment analysis. A single base pair separation is nearly impossible using an agarose gel (figure 2). Fragment size accuracy is also limited by manual methods because there is no way to view the standard and sample fragments loaded in the same lane.

The introduction of slab gel sequencers improved capacity to perform fragment analysis over manual agarose methods. Development of capillary analyzers has brought greater sensitivity and speed to this well-established process. Very little genomic DNA is now required to perform automated fragment analysis. Although science has developed new methods for sequencing, fragment analysis still remains an efficient and cost effective method to analyze genomic variability; particularly related to genetic disease and forensics.

Please go here if you would like to download a

reprint for this article in pdf format

Sanger Sequencing Amplification Compared to Basic PCR

Sanger sequencing, the process used for automated sequencing, requires a DNA template to be amplified by the Polymerase Chain Reaction (PCR). Despite similarities between the processes, a sequencing amplification is different than basic PCR.

Sanger sequencing utilizes linear amplification

PCR produces millions of copies of a DNA region from a single copy of template DNA. Each copy produced during PCR in one cycle becomes a new template for the next cycle. PCR uses forward and reverse primers. The forward primer anneals to a complimentary site on one strand of DNA and extends toward the reverse primer. In turn, the reverse primer similarly extends towards the forward primer. What results is a copy of the desired region of DNA to be amplified. The new copy contains priming sites so it can be used as a template for future amplifications (figure 1). One copy of the original template produces two copies; two copies produce four in the next cycle; and so on. A twenty-five cycle PCR will produce 2E24 copies from a single template.

Sanger sequencing uses one primer instead of two. The amplification process copies one strand but not the reverse strand. The copy is the same direction as the primer and cannot be used as a template for later cycles. All amplification is directly from the original template DNA in the reaction. Therefore, amplification is linear, not exponential. It is the reason that Sanger sequencing amplification must include sufficient copies of the original template DNA to be visualized by automated sequencing equipment (figure 2).

Dideoxynucleotide bases are included in Sanger sequencing

The components of basic PCR include buffer, the enzyme Taq polymerase, deoxynucleotides (dNTPs), template, and forward and reverse primers. Sanger sequencing includes an additional component called dideoxynulceotides (ddNTPs). The ddNTPs are terminating bases that include a fluorescent tag for automated sequencing equipment. For this reason, Sanger sequencing is also called dye-terminator sequencing. During amplification, the ddNTPs will randomly sit on the DNA template and terminate the extension. The dNTPs sit on the remaining templates and continue extending. The end product is a size ladder of PCR products that increase by a single base (figure 2). Each terminating base is tagged with fluorescent dye. This dye provides a unique color representing the A, G, C, and T bases in DNA.

The DNA ladder is separated by electrophoresis

Once PCR is complete, the products produced in the Sanger reaction are loaded on an automated slab gel or capillary analyzer. Products will separate by size with smaller products moving faster through the medium. As the products near the end of the medium, the fluorescent tags are excited by light and recorded to a computer with a digital camera (figure 3). The computer records the color for each band and assigns the correct base to complete dye-terminator sequencing.


Please go here if you would like to download a

reprint for this article in pdf format