DNA Sequencing and Fragment Analysis

Archive for the ‘Genetic Analysis Basics’ Category

Guidelines for Optimizing PCR: Concentration of Target DNA and Primers

The Polymerase Chain Reaction, or PCR, is a basic method used in molecular biology to produce copies of a small target region of DNA in a sample. The basics to PCR were discussed previously here. The copies of DNA produced by PCR provide researchers with sufficient copies for other applications in research including automated Sanger sequencing. Although there is basic methodology to most PCR methods, each reaction is different and requires optimization, a process for adjusting variables and producing a single desired product.  There are several factors to consider when optimizing PCR such as total copies of target DNA, primer concentration, MgCl2 and deoxynucleotides, or dNTPs.  Some of these variables depend on the total volume of the PCR reaction because the final concentration of the components in PCR should be constant depending on whether the reaction is 25 ul, 50 ul or 100 ul. In this article we will focus on two variables, the number of copies of the target DNA and primer concentration.

The Template: Target DNA

Generating copies of a target DNA region using PCR applications is not as sensitive to the quality of the template DNA when compared to Sanger sequencing. However, it is still advisable to use a relatively pure DNA sample free from salts and other contaminants. Clean template DNA has a better probability to generate a clean PCR product. The final diluted sample of target DNA is better diluted in water rather than buffer because buffers can interfere with difficult PCR amplifications.

The most important aspect of the target DNA to consider is the total number of copies in the reaction available for amplification. The target DNA provides the initial template for the amplification of the first set of products amplified and continues to provide the template for the remaining cycles. As PCR products are generated, they also provide copies of the target DNA used as a template for amplification. This is what allows PCR to generate millions of copies of a target region. Therefore, it is important that sufficient copies of the original target DNA are present in the reaction. Too many copies of the original target can lead to generation of false products early in PCR that also act as template DNA. The template DNA isolated from bacteria may consist of only a 2 million-base genome whereas the human genome has 3 billion bases. Therefore, bacterial genomic DNA will have far more copies of the target in a 50 ng sample than human DNA. For bacterial DNA 10E5 copies will require only 300 picograms of DNA. For human DNA 10E5 will require over 300 nanograms of DNA, a one million fold difference.

PCR conditions generally recommend 10E4 to 10E5 copies of the target DNA in the reaction independent of the total volume. There is some flexibility in the copy number of the target sequence. However, more copies of the target DNA will reduce specificity of the PCR reaction and likely produce a greater number of false products. The total number of cycles for PCR should be reduced when higher concentrations of target DNA are in the reaction.

Concentration of the Primers

Primers are the determining factor of what region of the DNA will be amplified by PCR. The forward and reverse primer must have an exact base match with the beginning and end of the target region. Excessive primer concentration is perhaps one important factor that often causes generation of false products in a PCR. Too much primer reduces specificity and this will allow primers to anneal in regions of the template that are not the target region. The results of excessive primers are often seen in unclean Sanger sequencing results because false products can be sequenced along with the desired target. The amount of forward and reverse primer should be limited to reduce potential false priming. Excessive concentrations of forward and reverse primers can also cause formation of primer dimer when the primers anneal and amplify themselves independent of the target DNA.

Primer concentration is one variable dependent on the total volume of the PCR reaction in order that sufficient copies of the primer find the target annealing sites. A total concentration of 0.5 micro-Molar (uM) to 1 uM is generally sufficient to amplify most target regions, although a smaller concentration may also work in some applications. Typically our lab uses a final concentration of 0.8 uM for most PCR reactions. The final judgment on primer concentration will be viewed after products are electrophoresed on an agarose gel in order to show the number of products amplified.

We use a relatively simple calculation to dilute primers to a final concentration of 10 uM as shown starting with the primary primer concentration of 1 micro-grams (ug)/ micro-liter (ul). It requires that the molecular weight (MW) of the primer is known and should be provided along with the primer.

1 ug/ul  *1umol/MW (ug) *10E6 ul/l  = concentration umol/l which equals  uM

A primer with the final concentration of 200 uM will be diluted by adding 1 ul of the primer to 19 ul of water for a final concentration of 10 uM. This is our working concentration for PCR. For a final concentration of 0.8 uM, 2 ul of the forward and reverse primer are added to a 25 ul reaction whereas 8 ul of each would be added to a 100 ul PCR reaction.

Primer concentration is one of the more important variables to consider when optimizing a PCR reaction. Concentrations greater than 1 uM could often lead to primers annealing along non-target regions and the generation of false products.  Insufficient concentrations of either primer could result in little or no amplification.
Please go here if you would like to download a

reprint for this article in pdf format

Guidelines for Optimizing PCR: Introduction

The Polymerase Chain Reaction (PCR) is one of the more utilized protocols in the genetic sciences. The development of PCR has allowed researchers to amplify a specific region of genomic DNA. It has made it possible to amplify millions of copies of DNA. PCR applications have expanded to include sequencing, fragment analysis, real time PCR, chip arrays and other techniques. Although the design of many of the new technologies differs from basic PCR, they all use the same principle to amplify DNA.

The PCR procedure itself has changed little over the years. However, better polymerase enzymes for catalyzing the process have been developed. The thermocycler for heating and cooling has even been improved. PCR reactions consist of a premix composed of deoxynucleotides (dNTPs) to supply the necessary bases and Taq polymerase to catalyze the reaction mixed in a buffered medium. Then a template and markers (forward and reverse primers) are added. The template is the DNA to be amplified. The markers determine what region is amplified. This soup is then placed in a thermocycler to be heated and cooled which causes the DNA to be amplified.

One of the more difficult issues with PCR is to ensure that only a single region of DNA is being amplified so that copies of that region only are all that is produced. This requires adjustments in the PCR mix and in the thermocycling conditions to optimize the reaction. Secondary products often result when PCR conditions are not fully optimized. It is particularly important in fragment analysis applications when multiple groups of primers are added to the same mix in order to amplify different regions together in one reaction.

Variables in PCR Optimization

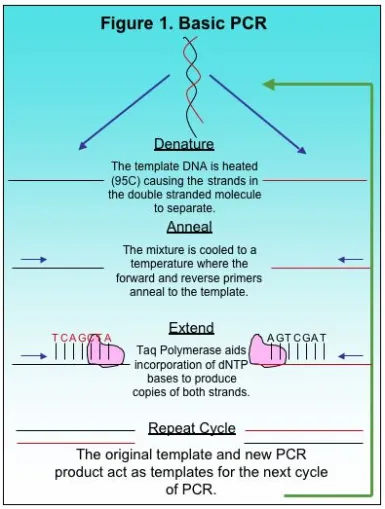
A typical PCR cycle is shown in Figure 1. The template and markers are added to a buffered solution containing Taq polymerase and dNTPS before the mixture is placed in the thermocycler. It is also important to note that the buffer includes magnesium chloride (MgCl2) as a necessary co-factor. A common cycle for PCR includes the denaturing step, the annealing step, and then the extension. The mix is first heated to approximately 95 C to denature the double stranded template. This opens up the DNA for the markers and Taq polymerase. After heating, the mixture is cooled to allow the markers to anneal to the complimentary region. Finally, the mix is heated slightly for extension. During extension, the polymerase moves along the template DNA incorporating dNTPs to produce a complimentary copy of the template. At the end of one cycle, an identical copy of the desired region is produced as a small PCR fragment. The newly produced fragment and the original template both function as template DNA for the next cycle in PCR amplification. After 25 cycles, millions of copies of a given region are produced and used for further study.

Image

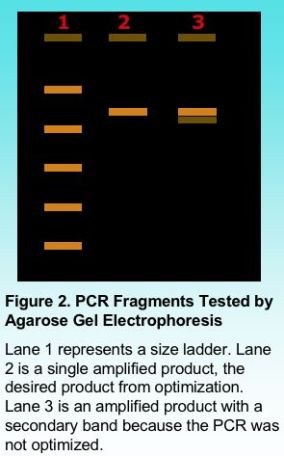
Once PCR amplification is complete, the PCR fragments can be tested for purity using agarose gel electrophoresis. Including a standard ladder with known fragment sizes provides an indication of the size of the amplified product as shown in Figure 2. Once PCR conditions are well optimized, the PCR product should appear as a clean single band. The presence of smaller secondary bands sometimes results from mis-priming when the PCR is not completely optimized. It is possible to gel purify a product by cutting the desired band from the gel and isolating the DNA using a commercial kit. However, even a single band can mask the presence of a secondary band. It is important to have a single clean product, particularly for additional testing such as automated DNA sequencing.

Image

PCR can be Multiplexed

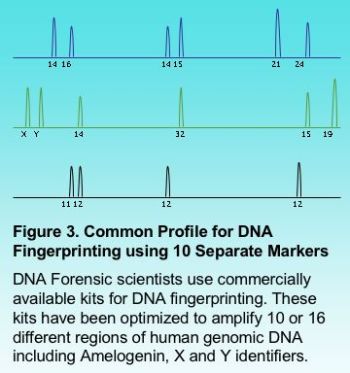
Multiplexing a PCR reaction is particularly useful in automated fragment analysis when different sets of markers carry a different fluorophore (fluorescent label). Multiplexing can provide savings in time and cost when a large number of samples are to be analyzed. Figure 3 shows the results for a fragment analysis application multiplexing 10 different markers. This is very common in forensic science where DNA fingerprinting typically multiplexes up to 16 different regions.

Image

The next few articles will focus on the variables involved in basic PCR and how PCR can be optimized.

Please go here if you would like to download a

reprint for this article in pdf format

Epigenetics Research Explores New Cancer Treatments

The genome consists of the entire DNA content in a cell. The human genome consists of approximately 3 billion bases. Many regions of DNA are simple base repeats that do not represent any gene. Some genes are inactive as defined by the epigenome, which plays a major role in cell differentiation. Each type†of cell contains the same copy of the genome. However, genes that are active in one type of cell, such as a skin cell, are not necessarily active in another type of cell, like a liver cell. The difference is found in the methylation of certain genome regions that cause binding to proteins called histones. Genes that lie within bound regions of the genome are silenced, meaning they are inactive.

The Epigenome’s Relation in Cancer

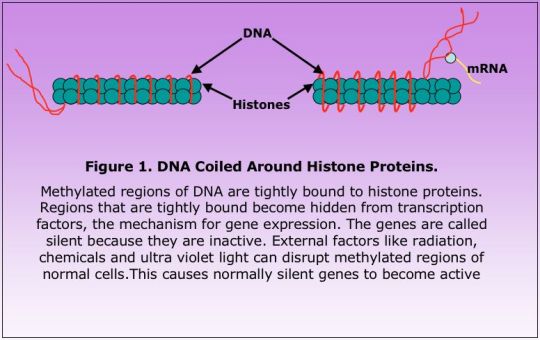
The epigenome can also affect whether certain individuals will develop cancer. People with the genetic potential to develop cancer may not necessarily become sick because the changes may be located in silenced regions of the genome. However, certain external factors can affect the epigenome, thus activating silenced genes. Tobacco, radiation, ultraviolet sunlight and other chemical or radioactive agents can disrupt normal methylation patterns in a group of cells (figure 1). The aging process also plays a role. Throughout life, cells die and are continually replaced. Over time, the number of cell division eventually leads to a loss in methylation for many cells. It is a reason why skin always exposed to sunlight tends to look older than normal skin. Fortunately damage to the epigenome is reversible.

Epigenetics2

Cancer Treatments in Epigenetic Studies

Researchers at a number of medical institutions are investigating epigenetic treatments for cancer. Most cancer treatments, like chemotherapy, work by killing cancer cells. However, these treatments may also kill healthy cells. Epigenetic treatments provide a more targeted approach to treating cancer by repairing epigenetic damage. A research team at John Hopkins is working with azacitidine and decitabine. Both medications were found toxic to healthy cells when used in high dosage. However, low dosages of the medications have little effect on healthy cells while repairing epigenetic damage. In vitro studies have shown that specific combinations of both treatments have reduced cultured tumor cells.

Epigenetics as a field has provided a new direction for cancer treatment. It has established that an individual has more control over the potential development of cancer by avoiding factors that cause epigenetic damage.

Please go here if you would like to download a

reprint for this article in pdf format

Metagenomics: A New Field of Genetics that Focuses on the Community Genome

Genetic research has evolved over the past ten years. The development of next generation sequencing has provided researchers with a tool capable of sequencing an entire microbial genome. Epigenetics is a new field in which science investigates external factors that effect cellular histones – the protein complexes that control gene expression. It has led to new developments in cancer research and treatment. Despite these new technologies, research still has limitations. Currently, less than one percent of bacterial species could be isolated into pure cultures under a laboratory setting. The answer to this problem is another new field in genetic studies called Metagenomics. In Metagenomics, the total microbial content of an environmental sample is isolated together to analyze the communal genome.

What is the Source of Metagenomic Samples

Samples used in Metagenomic studies are taken directly from the environment. The environment could be defined as soil, water, hot spring, or even inside the mouth of an animal. Each sample could harbor numerous species of microbes including bacteria, fungi and virus particles. We will primarily focus on bacteria cells.

Once the sample has been acquired, bacteria are isolated together. Different species are not separated into pure cultures. Because the environmental sample is unique in terms of mineral content, moisture, pH and other factors, the species of bacteria are related by their ability to grow in this environment. It is believed that the environment in some way shapes genetic development and expression similarly in different species. Therefore, each bacterial type shares basic genetic patterns.

How Are Environmental Species Analyzed

Once the bacteria have been separated from the environmental sample, the DNA is isolated using common extraction techniques. Once the DNA sample has been isolated and purified, the sample is analyzed using fragment analysis or DNA sequencing techniques. Next generation sequencing has been especially useful in determining the sequence of a communal genome. The figure below provides the basic steps in a Metagenomic study.

What is the Goal of Metagenomics

The entire sequence of a communal genome could be compared to bacteria taken from other environmental samples. A comparison of each communal genome could show how environmental factors have shaped the community. It could aid in determining how pollutants and other chemicals have altered basic gene sequences when compared to a relatively clean environmental sample. Another study could isolate bacteria from different seawater depths to compare genetic changes in the community as a result of pressure and light differences.

Fragment analysis is also a useful technique for examination of Metagenomic samples. It is a targeted approach investigating certain genetic functions. The genetic presence of a particular metabolic pathway such as the ability to metabolize a mineral is a good example.

Metagenomics as a field has provided a new way to look at an abundance of genetic material without the process of isolating separate species into pure cultures. It has helped to further understand environmental influences on genetic development. However, it does not yet show the complete relationship separate species living together may have on each other. An example of this is when one species produces a product utilized by another, thus shaping the genetic expression of both. However, it has led to new discoveries that could eventually impact the medical field.

Please go here if you would like to download a

reprint for this article in pdf format

Sanger Sequencing: Historical Development of Automated DNA Sequencing

During the 1970s, Frederick Sanger developed a new technique allowing the base sequence of DNA to be determined. The design of his method is still very popular today. Sanger employed dideoxynucleic acids, ddNTPs, in addition to deoxynucleic acids together in the amplification of DNA during the Polymerase Chain Reaction (PCR). Instead of amplifying a section of DNA, the ddNTPS would cause amplification to terminate in a random number of amplified products. The ddNTPs were also radioactively labeled for detection. The end result of the Sanger chemistry would be a series of new DNA products with sizes increasing by a single base.

The PCR products were separated on a medium, polyacrylamide gel, with smaller products migrating faster than the larger products. The end result appeared like a ladder when detected.

The basics of the chemistry remain the same today. What has changed in Sanger sequencing is the method of separating the products and detection.

Original Base Labels were Radioactive

Before development of the fluorophore, Sanger labeled ddNTPs with a radioactive tag on the 5 prime end of the base. Because there was no method that could identify the different bases, a sample was amplified by PCR in four separate tubes. Each tube represented one of the four bases making up DNA. The amplified products were loaded separately into four lanes and allowed to migrate. Once complete, the gel was photographed by x-ray to view the result as shown in figure 1.

Fluorescent Labeled ddNTPs Replaced Radioactive Labels

Automation replaced the manual sequencing method with development of fluorescent labeled ddNTPs. Slab gels were still poured. However, all four bases were combined into a single reaction and loaded together. Samples would electrophorese and separate in the gel. Once the amplified products reached a region on the bottom of the plates, a laser would excite the fluorescent labels and color would be recorded by camera. Resulting images were collected by computer and analyzed as shown in figure 2.

Development of the automated chemistry allowed sequencing to be performed much faster. First, one lane on the gel was required for each sample. Second, sequence was recorded as electrophoresis was performed. The smaller more quickly migrating bands could be run completely through the gel as larger bands were recorded. Therefore more bases could be determined.

The problem that potentially occurred was in the plates. Because sequence results were recorded through the plates, the plates needed to be clean from debris and clear of any scratches. Although plates also needed to be clean for the radioactive method, it was more stringent for automated sequencing.

A significant amount of sequencing was performed using automated slab gel sequencing. But researchers still needed to pour plates and electrophoresis was performed for 12 hours or longer.

Capillary Sanger Sequencing

Capillary development occurred during the 1990s beginning with a single capillary machine, the ABI 310. The new technology eliminated any need for pouring gels. Instead, semi-liquid polymer was injected into the capillary before each run as shown in figure 3. Individual runs reduced the length of time required for electrophoresis to less than 3 hours.

The automated process changed very little from slab gel machines to capillary. But capillary sequencing was faster and more sensitive. It required much less DNA added to the PCR amplification. Better chemistries were developed in conjunction with automated sequencing. Capillary sequencers today characteristically perform 4 to 96 samples in a single run. The runs generally require 2 to 2 ½ hours of electrophoresis. Automated injection of samples allows hands-off operation through multiple sets of samples.

Frederick Sanger developed an important method for sequencing DNA. It allowed early completion of the human genome project, a genome with 3 billion bases. Although next-generation sequencing has expanded sequencing capabilities, Sanger sequencing is used for small sections of DNA often used in medical research.

Please go here if you would like to download a

reprint for this article in pdf format

Epigenetics: A New Field of Genetic Research

Epigenetics is a relatively new field of research that goes beyond gene expression. It encompasses important areas of research including cell differentiation, cancer and the aging process. Despite complete sequencing of the human genome, there is still much to learn about the complexity of an individual genetic blueprint. Epigenetic research is working to better understand how cells develop into specialized tissue and perform a specified number of functions. The human begins as a single fertilized egg. The egg divides into a growing mass of identical cells. Eventually, individual groups of cells begin to look and act different than other cells. Cell groups develop into tissue and organs. How does this happen when every cell has the same genetic code?

Proximity could play a partial role in cell differentiation. Cells adhering together generally develop into the same tissue. But what boundaries separate each group?

The answers may rest in understanding the epigenome. Epigenetics is a complex field newly emerging in the genetic sciences. Although there is much to learn, there is some basic understanding summarized here.

Histones Play an Important Role in Controlling Gene Expression

DNA is a double stranded molecule that coils around into a helical formation wrapped around histone molecules. Histones are a group of proteins that condense long DNA strands. It is similar to string wrapped around a spool. How tightly DNA is wrapped around the histone molecule determines whether a particular region of DNA is available for transcription and gene expression. Tightly wound DNA is essentially hidden and this region is repressed. Other regions are loosely wound and available for transcription. Transcription is the first step in the protein production process (Figure 1).

Histone molecules are classified into one of five main groups. They are modified in the cell by chemical processes such as methylation, acetylation or other known modifications. Modification is one factor that determines whether DNA is active or repressed. Methylation of certain groups of histones allows genes to be active while others are repressed. However, external factors (like radiation) could effectively influence methylation and activate repressed genes.

Epigenetic Damage is a Cause of Cancer

Let us examine a hypothetical situation in which two individuals have identical genetic content. They are twins. Each individual has identical genes including genes that potentially cause cancer. Why does one individual develop cancer and the other does not?

Research has long understood that cancer could be caused by damage to the DNA making up the genetic blueprint. But external factors can cause damage to DNA leading to cancer as well. Factors that damage the epigenome of an individual can have the same result. An environmental factor like smoking is an example. When cells lose levels of control, they also lose specialization; they de-differentiate. Without such important controls, cells begin to divide uncontrollably into cancer. A better understanding of epigenetic damage has led to new directions in cancer treatment.

Dr. Jean-Pierre Issa explained some general aspects concerning cancer and epigenetic damage during an interview with Nova. See Nova article here.  Epigenetic damage could be related to the aging process. As an individual continues to age, cell division eventually leads to errors in the epigenome. For example, skin constantly exposed to sunlight radiation appears older than normal skin. The aging process is accelerated by stem cells dividing to repair sun damaged skin tissue. The more cells divide, the more the aging processes are accelerated. Dr. Issa utilizes this knowledge in research to determine the apparent age of certain cells.

What Affects the Epigenome?

Current research is attempting to answer this question. There are a number of known environmental conditions that cause damage to the epigenome. Radiation, tobacco and other chemicals have the potential to damage the cellular epigenome. As previously stated, the radiation from excessive sunlight can cause damage to skin tissue. Stem cells divide to repair damaged skin. Damage to skin tissue causes the need for repair and accelerates the aging of stem cells.

Epigenetics is a fascinating new field in the genetic sciences. Understanding factors that affect the epigenome has led medicine into exciting new areas of treatment. This topic is certain to be examined often in the near future.

Please go here if you would like to download a

reprint for this article in pdf format

Preparing Plasmid DNA for Automated Sanger Sequencing

Cesium chloride and phenyl chloroform were two early methods used for isolating a sample of DNA from a bacterial vector. Cesium chloride produced a sample that was very clean. However, the method was labor intensive. Phenyl chloroform was less labor intensive, but phenyl contamination was difficult to remove even using the final alcohol precipitation step. Fortunately, commercial kits were developed around the same time Sanger sequencing became automated. Presently there are numerous commercial kits from which a researcher could choose.

However, using a commercial kit does not guarantee that a resulting DNA sample will be clean and free from contaminants. The final step of the sample preparation often includes Tris or another buffer (salt) for elution. Other times the DNA may incur physical damage and become nicked. Preparing a sample for automated sequencing includes following the recommended guidelines provided for the commercial kit. However, low yields can require additional steps to concentrate the sample. Simple drying methods concentrate everything in the sample including buffer salts.

Steps Involved in Commercial DNA Preparation Kits

The general protocol for commercial kits used to isolate purified DNA from plasmids is fairly similar regardless of the kit. After plasmid bacteria have been grown overnight in liquid media, the cells are pelleted by centrifugation into a solid mass. The media is then discarded before beginning the kit provided procedure (Figure 1).

The pellet of cells is resuspended in buffer and transferred into a 1.5 or 2 ml tube (Step 1). Lysis reagent is added (Step 2). The lysis reagent disrupts the bacterial cell membranes freeing internal components. The lysis buffer is neutralized with neutralizing solution and cell components form a precipitate with the DNA still in solution (Step 3). The resulting solution is centrifuged to pellet the cell waste leaving the DNA in solution.

DNA is captured on a filter or resin by transferring the DNA solution to a collection vessel (Step 4). Excess liquid is pulled through the filter by centrifugation or vacuum filtration. The remaining DNA on the filter is then washed removing any cell waste left (step 5). The DNA is then collected in a clean tube using water or elution buffer (step 6). Elution buffer is provided in the commercial kits. It is comprised of Tris buffer in water. Fortunately, manufacturers no longer include EDTA in elution buffer. EDTA interferes with magnesium chloride, a necessary component in any PCR amplification. Water is the preferred media for DNA to be used for Sanger sequencing as no salts are being introduced to the sample.

The process may take as little as 15 minutes after bacterial cells are grown overnight. The final DNA sample is relatively pure and clean from other cellular debris that could interfere with Sanger sequencing.

Quality Testing of the DNA Sample

DNA sample quality can be determined using two simple methods. The methods will be discussed in detail in the next article, but are summarized below.

Scanning spectrophotometry using ultraviolet wavelengths between 220 nm and 310 nm provides a general profile of the overall quality of the DNA (Figure 2). DNA absorbs light in the range of 240 nm to 300 nm with the maximum peak at 260 nm. Absorbance at 260 nm is also used to calculate the concentration of the DNA. Another factor often used when measuring DNA quality is calculating the 260 nm / 280 nm absorbance ratio. A good value for this ratio is 1.8 to 1.9. Ratio values below 1.6 indicate the DNA sample contains contaminants.

A good scanning profile does not always prove the DNA is good. Nicked DNA cannot be identified by scanning and may inhibit quality Sanger sequencing. (https://agctsequencing.wordpress.com/2012/02/16/nicked-plasmid-dna-prevents-automated-sanger-sequencing/)

Agarose gel electrophoresis will separate DNA into bands indicating whether the DNA has remained supercoiled.  This supercoiled DNA is required for sequencing. It will also show if the DNA has been damaged and the supercoil has loosened when the DNA is nicked. Nicked DNA migrates more slowly through an agarose gel and will separate from the supercoiled DNA.

Both quality tests provide necessary data to show whether the final DNA sample is clean and of high quality.

Additional Concentration Required

Once the DNA sample has been isolated and appears clean using test procedures, it may be necessary to adjust the concentration to meet submission guidelines. Samples with a concentration higher than required are diluted in water. Although some buffer is still present, the buffer is diluted along with the DNA. Generally dilute buffers (without EDTA) do not interfere with amplification for Sanger sequencing. What if the sample needs to be more concentrated?

Drying a sample in elution buffer is not an effective means for concentrating a sample. Ethanol precipitation is a preferred method because salts are removed along with excess water. Scanning spectrophotometry is an effective means of quantifying the DNA.

What is most important for researchers to remember when isolating plasmid DNA with a commercial kit is to thoroughly read the directions. The kits use enzymes to disrupt the bacterial cell membrane and remove components such as RNA. Enzymes are fragile. Excess shaking or vortexing could damage the enzymes. Commercial kits often include precautions to use care when working with these important enzymes.

Please go here if you would like to download a

reprint for this article in pdf format

Automated Fragment Analysis Improves Accuracy Over Manual Methods

Automated capillary sequencers are also capable of performing fragment analysis applications. The process is similar to sequencing because fluorescent dyes are used to label products amplified by PCR. Fragment analysis is often performed manually loading amplified products on agarose gel. It is a relatively simple and cost effective method for conducting fragment analysis. However, there are also limitations. First, there is no method for accurately calculating fragment sizes even with a size ladder. Second, multiplexing is not possible when product sizes from multiple primer pairs (markers) are similar in size. Finally, agarose gels does not have the resolution capabilities that capillary electrophoresis has. Capillary electrophoresis, used in forensics fingerprinting, provides remarkable accuracy to fragment analysis applications.

Automated Fragment Analysis Uses Color Fluorescent Dyes

The Polymerase Chain Reaction (PCR) first amplifies samples that will be compared by fragment analysis. For manual applications, the forward and reverse primer are simply unlabeled oligonucleotides. For automated capillary equipment the forward primer contains a fluorescent label on the 5’end. The amplified product will also be labeled following PCR because the product includes both primers (figure 1). The forward and reverse primers (markers) determine the region and base pair size of the resulting amplification.

There are advantages to using fluorescent labels in the amplification process. Capillary analyzers recognize fluorescent emission wavelengths (different colors). This adds the capacity to multiplex more than one set of primers in an amplification reaction. For example, forensic science currently runs 16 separate markers in one multiplexed reaction. Markers are labeled with four different fluorescent dyes. Fragment sizes add a second parameter because fragments with the same dye, but amplified with different markers, never overlap.

A Standard is Added to Every Sample

Another parameter that increases accuracy and resolution in automated fragment analysis applications is the addition of a given standard to every sample. The base pair sizes of test samples are calculated using this standard. Motility variance that could occur from one capillary to the next is eliminated because a standard curve is determined for each capillary. Each fragment in the standard would need to be labeled with fluorescent dye. However, the standard uses a unique label not used for any of the samples, typically ROX or TAMRA.

Resolution of Automated Capillary Fragment Analysis is 1 Base Pair

The resolution capability of capillary fragment analysis is 1 base pair. The same technology that separates each base in sequencing is also applied to fragment analysis. A single base pair separation is nearly impossible using an agarose gel (figure 2). Fragment size accuracy is also limited by manual methods because there is no way to view the standard and sample fragments loaded in the same lane.

The introduction of slab gel sequencers improved capacity to perform fragment analysis over manual agarose methods. Development of capillary analyzers has brought greater sensitivity and speed to this well-established process. Very little genomic DNA is now required to perform automated fragment analysis. Although science has developed new methods for sequencing, fragment analysis still remains an efficient and cost effective method to analyze genomic variability; particularly related to genetic disease and forensics.

Please go here if you would like to download a

reprint for this article in pdf format

DNA Fragments Resolve Better on Correct Percent Agarose Gel

An interesting article was posted March 25, 2011 on BitesizeBio.com titled 5 Ways to Destroy Your Agarose Gel. Every researcher may have made some of these common mistakes at one time. The five ways provided are…

  1. Use water instead of buffer for the gel or running buffer.
  2. Forget to add ethidium bromide
  3. Use the wrong percentage (or type) of agarose.
  4. Switch the leads from the power source.
  5. Drop the gel on the way to the imager.

The focus of this article is to explain the importance of using the correct percentage gel. In many genetic analysis applications a 1% agarose gel is commonly used to test plasmid preparations and PCR fragments. However, the resolution of the 1% gel may not sufficiently resolve smaller DNA products.

Percent Agarose Determines Pore Size

Agarose gel electrophoresis is a form of chromatography. The gel provides the stationary phase and electrical current provides the mobile phase. Charged particles such as DNA will migrate towards the positively charged anode in response to an electrical current across the gel. The gel provides the resistance against DNA migration. Smaller fragments move more rapidly than larger fragments.

Resistance is directly proportional to the porous nature of an agarose gel. Smaller pores provide more resistance. Increasing the percent of the gel decreases the size of the pores. When the pore sizes are too large small DNA fragments migrate together and do not become separated (figure 1). This figure illustrates why large DNA fragments should not be run on an agarose gel with small fragments of DNA.

Correct Percent of Agarose Depends on the Size Products Tested

The correct percent agarose gel is dependant on the size of the fragment that will be tested. Plasmid DNA preparations that are 5 kb to7 kb resolve well on a 1% gel. Large PCR fragments that are similar in size to plasmid DNA could also resolve on a 1 % percent gel. However, small PCR fragments that require smaller pore size for better resolution require a higher percent gel. General guidelines for mixing the correct percent gel are provided in table 1.

For small PCR fragments less than 500 bases in size, it is best to use a two percent gel. This will increase the run time. However, it will also improve resolution of fragments that are similar in size and may not resolve on lower percentage gels.

Credits:

http://bitesizebio.com/articles/5-ways-to-destroy-your-agarose-gel/

Role of Restriction Enzymes in Mapping DNA

Restriction mapping was one of the earlier methods designed to characterize a fragment of DNA. The fragment was cut into smaller fragments using a restriction endonuclease. This is an enzyme capable of recognizing a specific base sequence. Once the region is identified, the enzyme cleaves (cuts) the DNA. It is an effective method used to mark a specific sequence along a region of DNA.

What Are Restriction Endonucleases?

Restriction endonucleases are a group of enzymes capable of cutting DNA into smaller pieces. Each enzyme recognizes a specific sequence that is generally 4 to 8 bases in length. EcoR1 is a popular enzyme that cuts a DNA fragment wherever GAATTC is found. It should be noted that this sequence is a palindrome. That means the sequence is the same for forward and complimentary directions.

Most restriction endonucleases used today originated from bacteria. It is one mechanism microorganisms use as defense against foreign DNA such as bacteriophage. Foreign DNA cleaved into smaller fragments loses functionality and becomes harmless to infected bacterial cells. Each restriction enzyme is labeled from the bacterial species of origin. EcoR1 is an enzyme isolated from Escherichia coli.

Restriction Digest:

A fragment of DNA in solution is treated with a specified restriction endonuclease in a process called restriction digest. One example is treatment of a 5,000 base pair (5kb) fragment with EcoR1. The enzyme will cleave (cut) the DNA fragment every time GAATTC is found in the sequence. For example, the digest generates 5 smaller fragments with sizes 250 bp, 500 bp, 750 bp, 1,500 bp and 2,000 bp. The sum of the fragments equals 5 kb. But, how does a researcher know the smaller fragments have been generated when the DNA size is not visible in solution? Fragment sizes are visualized using gel electrophoresis.

Agarose Gel Electrophoresis:

DNA fragments of different size can be separated on agarose gel in a process called electrophoresis. The solution, with digested DNA added, is loaded on a buffered agarose gel. DNA fragments will migrate towards the positive charged anode when electric current is applied (figure 1).

Smaller fragments move through the gel more quickly than larger fragments so the fragments become separated. Once separation is complete, the DNA is stained with a dye such as ethidium bromide. Different size fragments appear as bands when exposed to ultraviolet light. The size of each fragment is estimated when electrophoresed with a standard ladder of known DNA fragments.

Partial Digest Aids Genetic Mapping

Researchers use a technique called partial digest to determine the order of fragments resulting from a full enzyme digest. A partial digest generally cleaves a DNA fragment on some, but not all, of the sites where the enzyme cut site would be. Partial digest could be performed by reducing the amount of time of digest or amount of enzyme added to the solution. One example would be the generation of 2,750 bp, 2,500 bp, 1,750 bp and 1,250 bp (figure 2)

Because smaller fragments from a full digest are multiples of the fragments from the partial digest, it is possible to determine the order of fragments along the original DNA fragment (figure 3).

Researchers perform restriction mapping along an unknown region of DNA using a combination of restriction endonucleases. It provides a relatively simple method to mark regions along the DNA that could be used in future studies. Unknown fragments that could be cut by these enzymes could also be inserted into a bacteria cell called a plasmid providing known markers (primers) that can be used to determine the entire sequence.

Please go here if you would like to download a

reprint for this article in pdf format